
Ask an AI about this page
 ChatGPT
 Claude
 Perplexity
 Google AI Mode
 Microsoft Copilot
 Grok
Grok Mistral Le Chat
Install Power BI Desktop and build your first report
Updated For Microsoft 365

Power BI Desktop is Microsoft’s free Windows app for building reports. In this guide you install it, load a sales spreadsheet, and build a simple report with a column chart of sales by month and a card showing total sales. The whole report is saved on your computer as one .pbix file.
We tested these steps on 27 September 2026 in Power BI Desktop from the Microsoft Store on Windows 11, with a sample file of fictional sales, “Contoh - Jualan.xlsx”. It has four columns: Month, Product, Region and Sales (RM).
Install Power BI Desktop
Section titled “Install Power BI Desktop”Microsoft offers two ways to install Power BI Desktop. We recommend the Microsoft Store, because Windows then keeps the app up to date for you and you do not need admin rights on the computer.
-
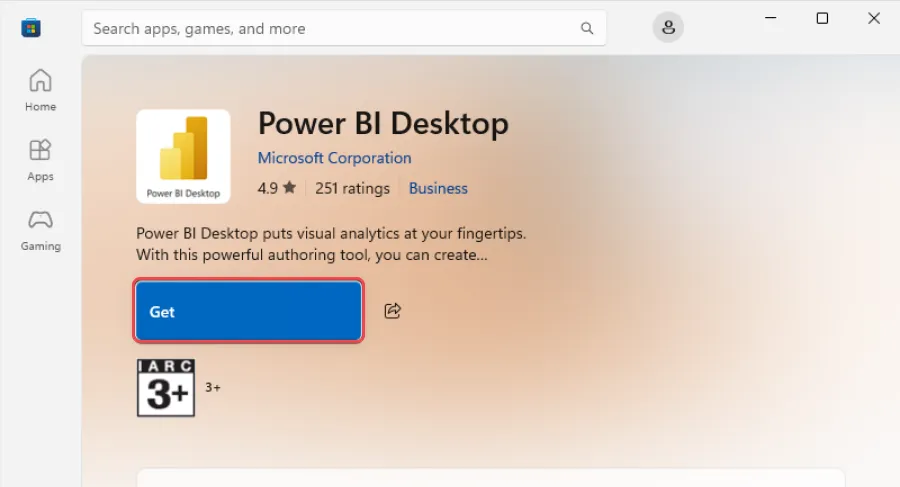
Open the Microsoft Store app on Windows and search for Power BI Desktop.
-
Check the publisher is Microsoft Corporation, then select Get.
-
When the download finishes (it is about 900 MB), select Open.
If your company does not allow the Microsoft Store, download the installer from Microsoft’s Get Power BI Desktop page instead. Microsoft releases a new version every month, and the downloaded version does not update itself.
Sign in
Section titled “Sign in”Power BI Desktop asks you to sign in when you select Sign in at the top right. Signing in is needed to publish reports, not to build them.
-
Select Sign in at the top right.
-
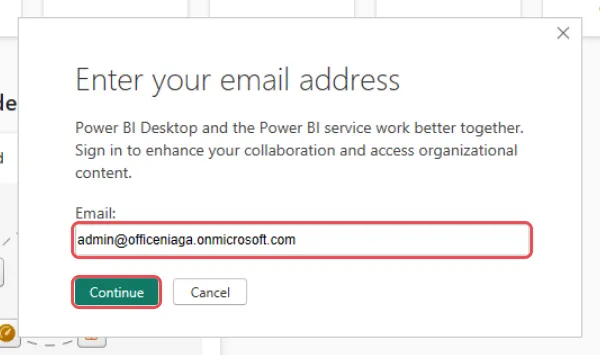
Type your work email in Email and select Continue.
-
Type your password and complete two-step verification, as you do for Microsoft 365.
-
If Microsoft asks Sign in to all apps and websites on this device?, select No, this app only on a shared computer.
If Power BI Desktop then says Check your browser to complete the Power BI sign up process, your account has no Power BI licence yet. Select Cancel and carry on: you can build and save reports without signing in. See publish and share a report for what to do next.
Load your Excel file
Section titled “Load your Excel file”Keep your data in an Excel table with one header row, as in our sample file. Power BI reads the column names from that row.
-
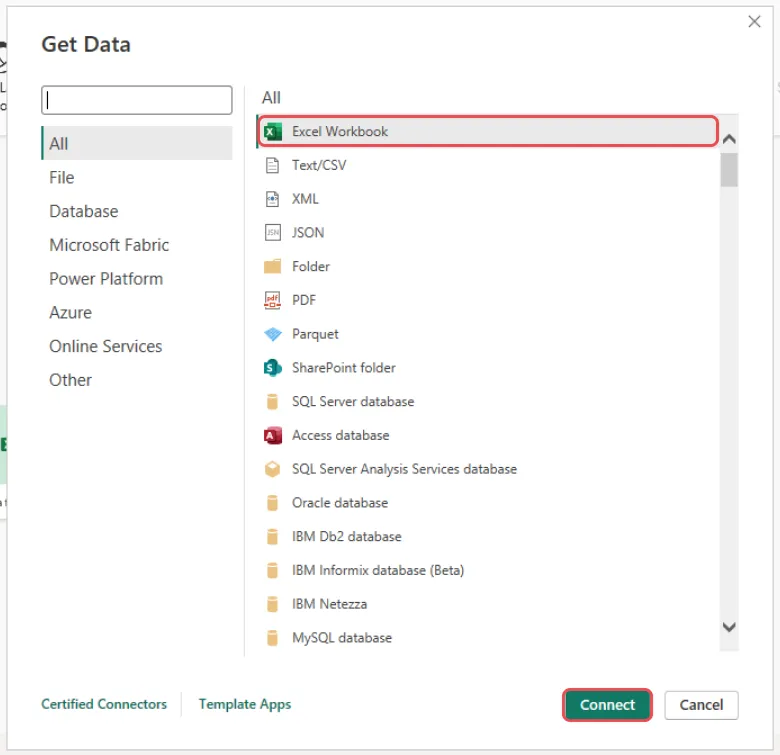
On the Home tab, select Get data. In the Get Data box, select Excel Workbook, then Connect. The Excel workbook button on the Home tab does the same in one step.
-
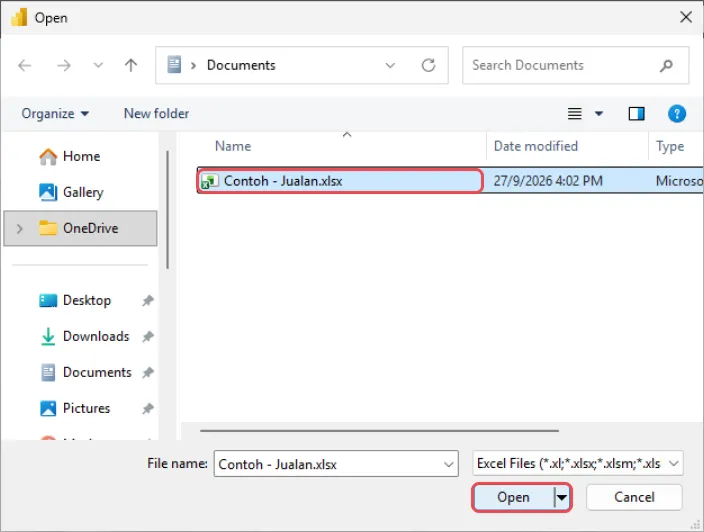
Find your file, select it, and select Open.
-
In Navigator, tick the table (the icon with a blue header row). The preview on the right shows your data. Check the columns and figures look right.
-
Select Load.
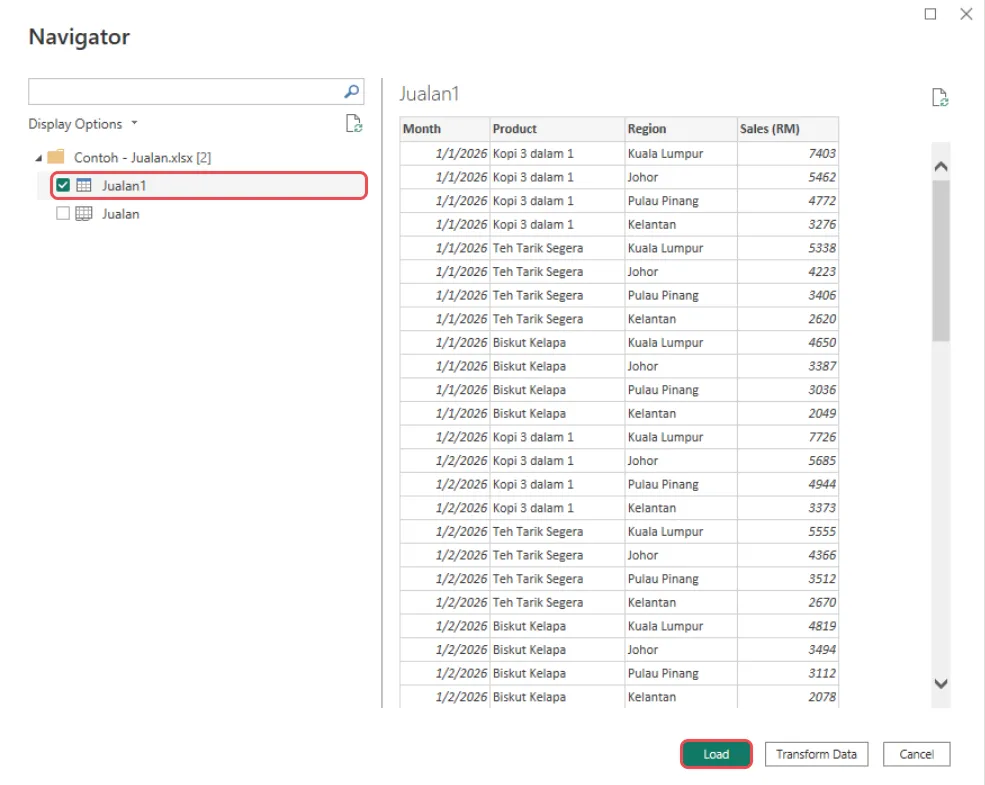
When loading finishes, your table and its columns appear in the Data pane on the right.
Add a column chart of sales by month
Section titled “Add a column chart of sales by month”A column chart shows one bar for each month, so you can see at a glance whether sales are growing.
-
In the Visualizations pane, select Clustered column chart. An empty chart appears on the page.
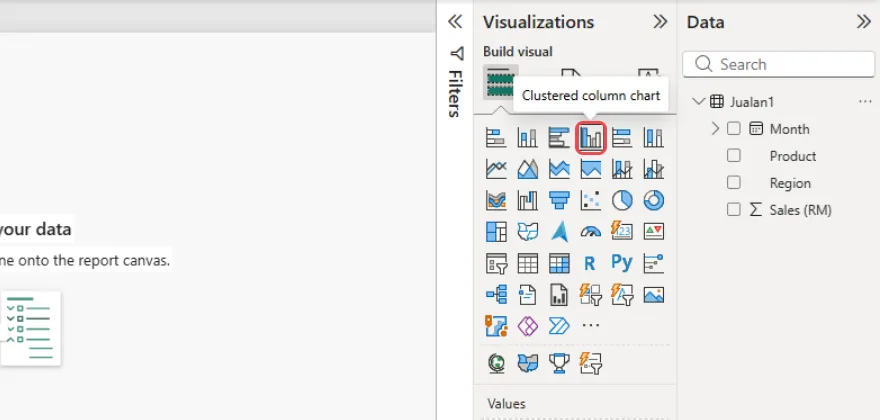
-
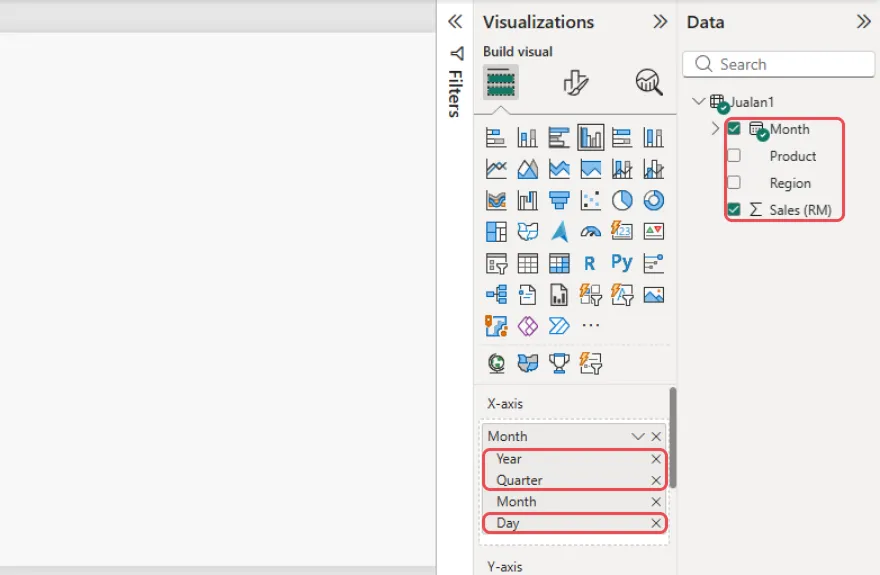
With the chart selected, tick Month and Sales (RM) in the Data pane.
-
Power BI splits dates into Year, Quarter, Month and Day, and shows only the year at first. In the X-axis box, select the X next to Year, Quarter and Day to remove them. Leave Month.
-
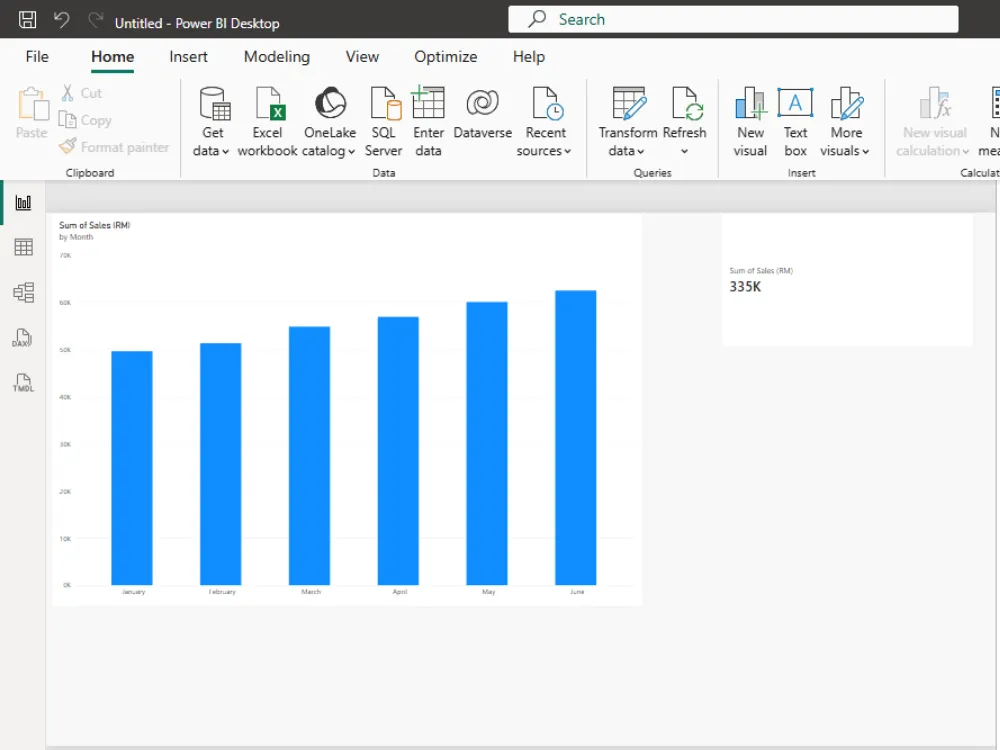
The chart now shows one bar for each month, January to June. Drag the corner of the chart to make it bigger.
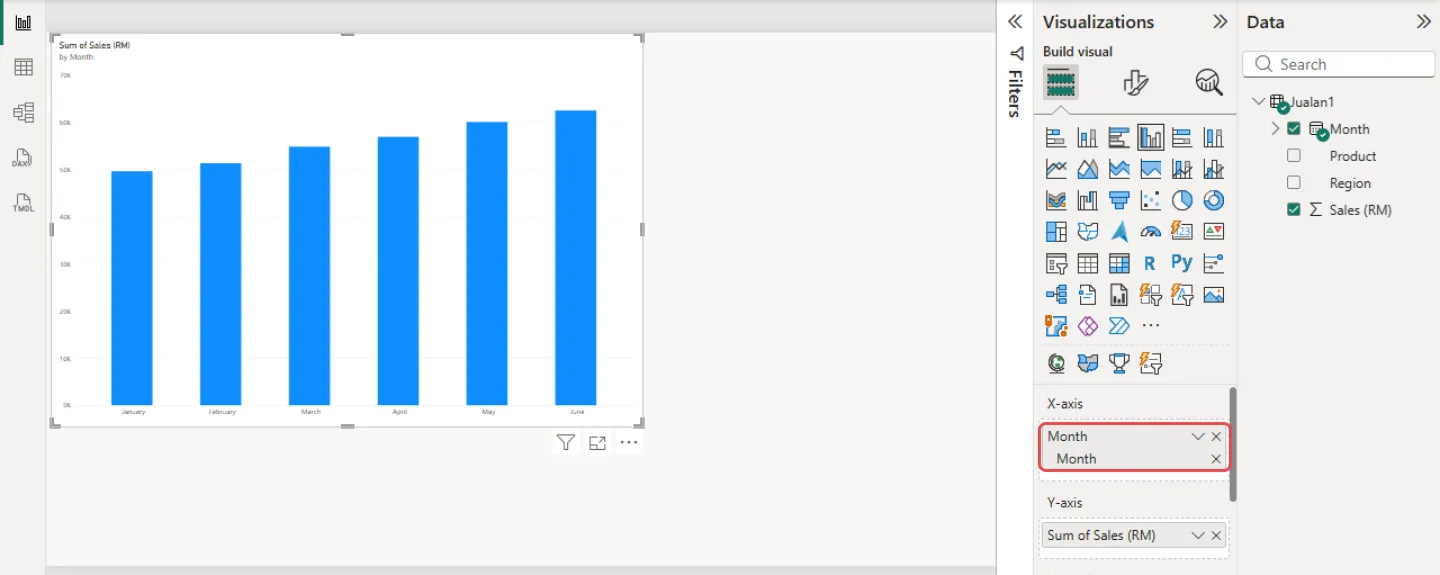
Power BI adds up the sales for each month and titles the chart Sum of Sales (RM) by Month.
Add a card for total sales
Section titled “Add a card for total sales”A card shows one big number. It is a good way to put the total at the top of a report.
-
Select an empty part of the page, so the chart is no longer selected.
-
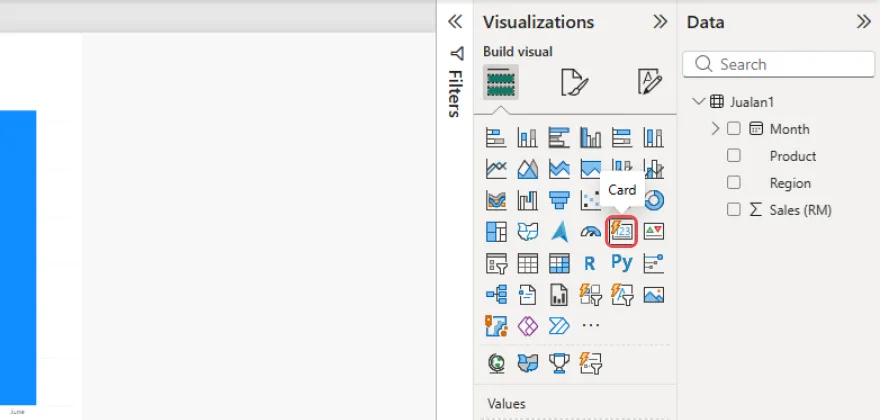
In the Visualizations pane, select Card.
-
Tick Sales (RM) in the Data pane. The card shows the total for all months, such as 335K.
-
Drag the card to where you want it, and drag its edges to resize it.
Save the report
Section titled “Save the report”Save your report as a .pbix file. It holds the report pages and a copy of the data, so you can open it again later or publish it.
-
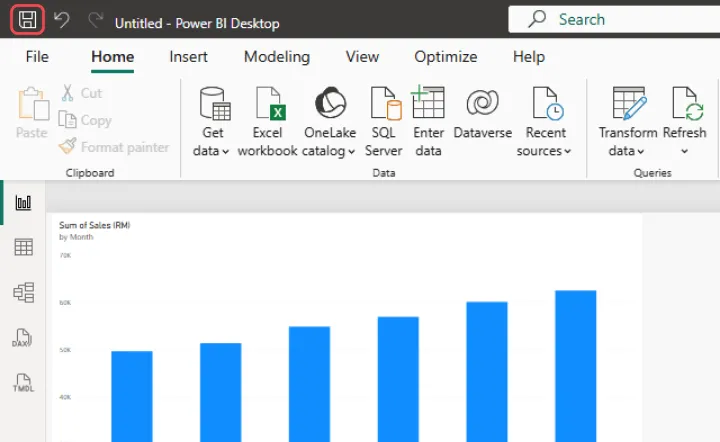
Select Save (the disk icon) at the top left, or press Ctrl + S.
-
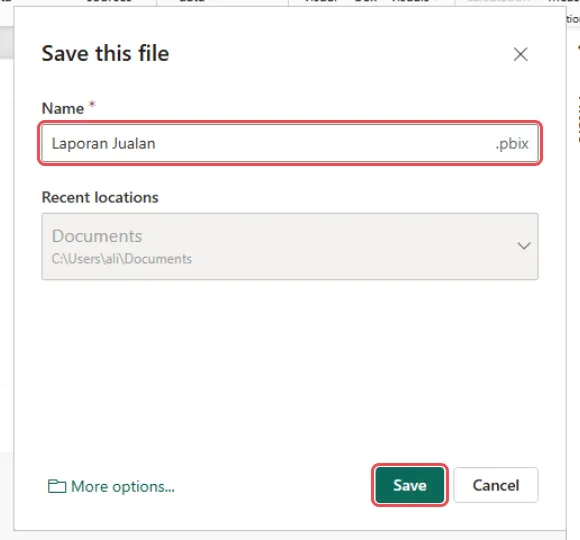
In the Save this file box, type a name in Name, such as “Laporan Jualan”. Power BI adds
.pbixfor you. -
Check Recent locations shows the folder you want, such as Documents, and select Save.
To save in a different folder, select More options… in the box, then Browse this device.
The name at the top of the window changes to your file name. Next time, press Ctrl + S or select Save again.
Next step
Section titled “Next step”To open the report in a browser or share it with colleagues, publish it to the Power BI service. Sharing needs Power BI Pro; see which licence you need.
Still stuck
Section titled “Still stuck”WhatsApp our support team at +60 16-916 3324.
Common issues
My chart shows one bar labelled 2026 instead of one bar per month.
Power BI groups dates by Year first. In the X-axis box, remove Year, Quarter and Day with the X next to each, and keep Month.
Navigator shows my file twice, once with a table icon and once with a sheet icon.
The table icon is the Excel table and the sheet icon is the whole worksheet. Tick the table: it contains only your data, with the header row already set.
After I sign in, Power BI Desktop says to check my browser to complete the sign-up.
Your account does not have a Power BI licence yet. You can select Cancel and keep building reports without signing in. You only need to sign in to publish. See publish and share a report.
I changed the Excel file. Why doesn't the report change?
Power BI keeps a copy of the data. Select Refresh on the Home tab to load the latest figures from the Excel file.
Was this article helpful?
Thanks for your feedback.
Sorry this didn't help. WhatsApp us and we'll sort it out with you.